Skip to case study

Case study, fintech product

EdgeTest

edgetest.in
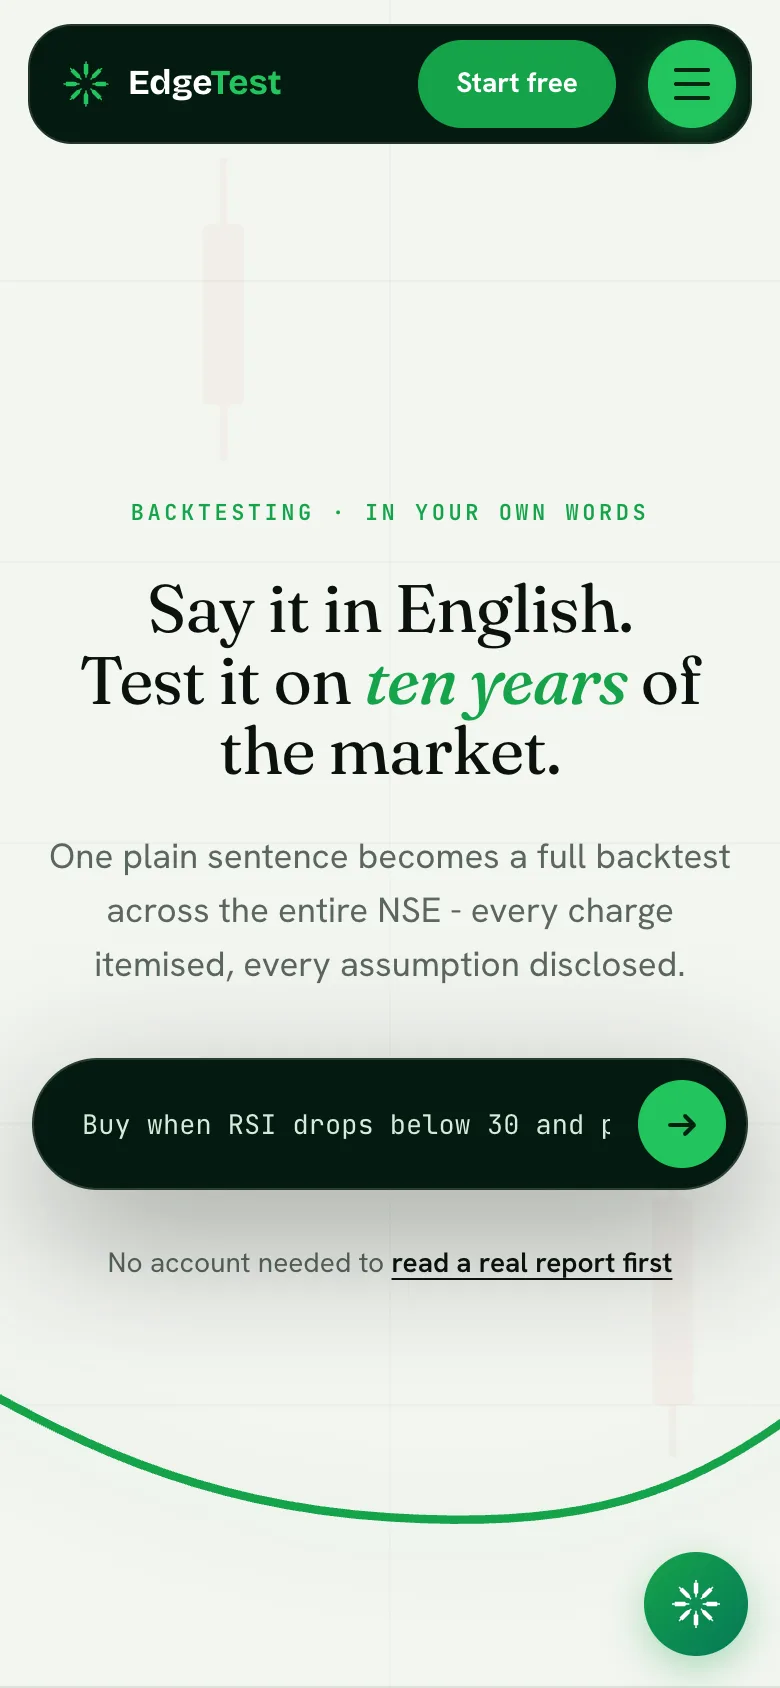
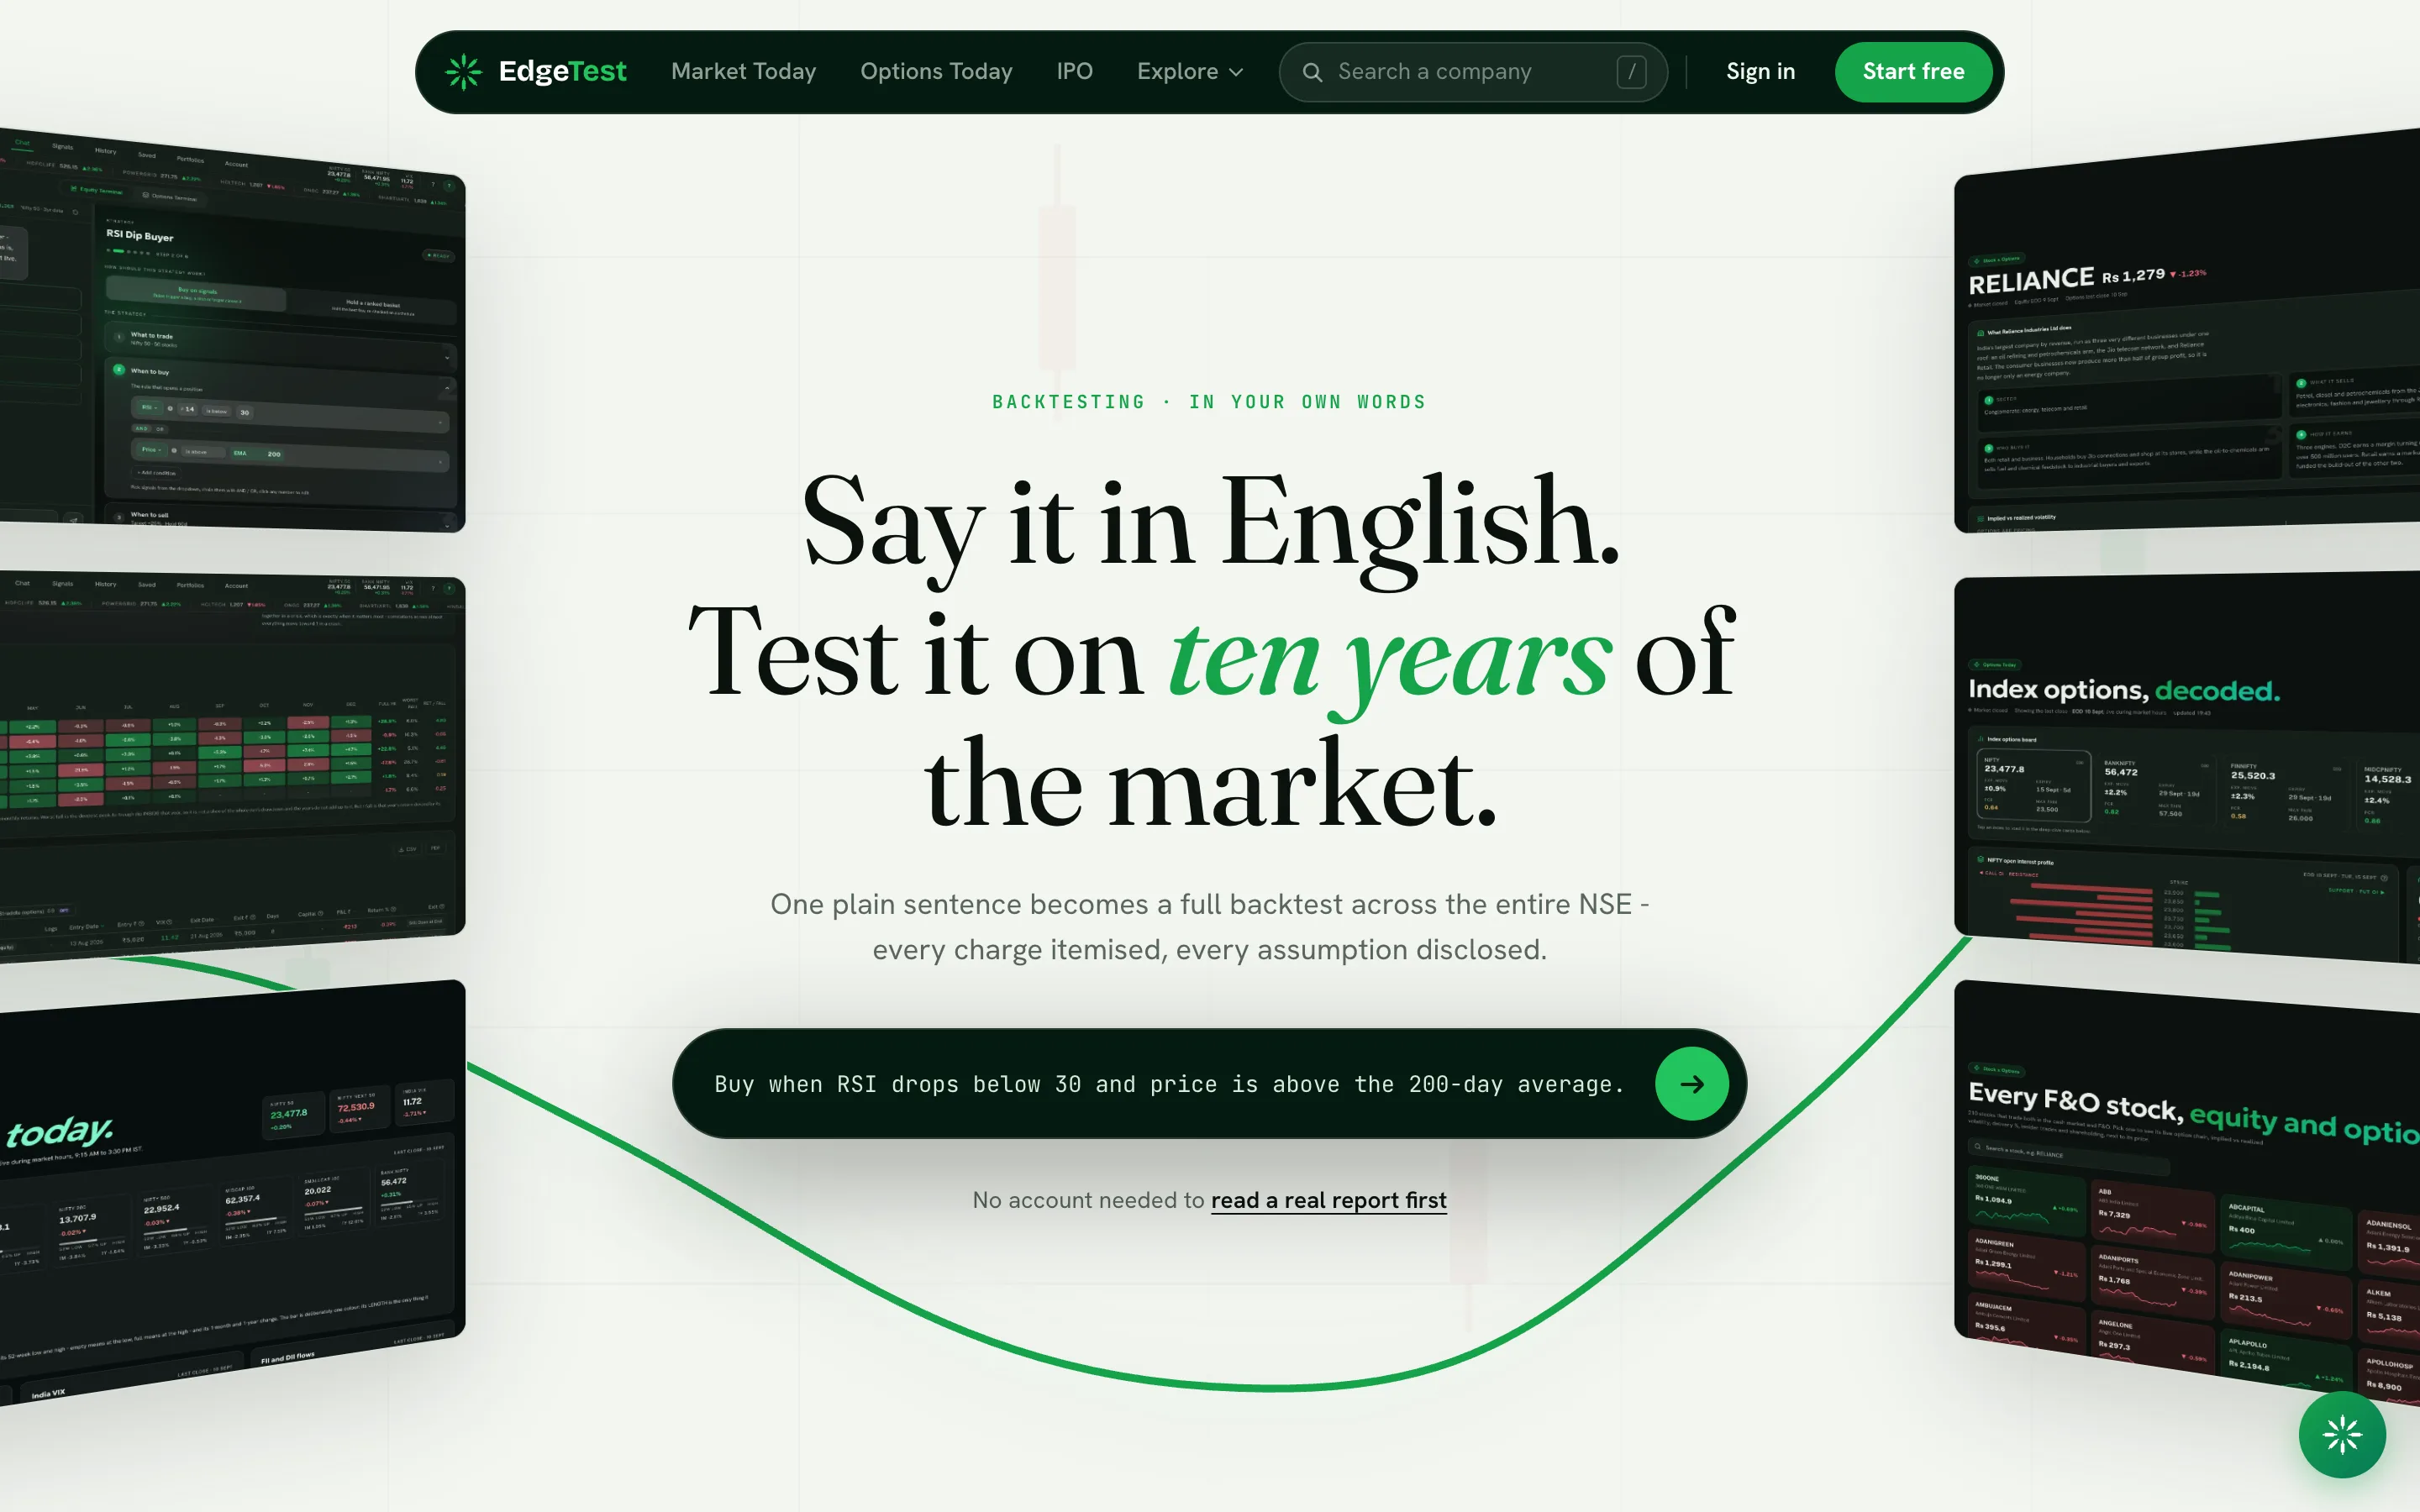
EdgeTest home page: the headline 'Say it in English. Test it on ten years of the market.' above a strategy input field

Backtesting used to mean Python or spreadsheets. I made it a sentence you type, and a report you can actually trust.

My role
Product design, full-stack build, growth
Built with
Next.js, Python, Supabase
Data
10 years of NSE history

The brief

Retail traders in India have plenty of ideas and almost no way to test them. Checking a strategy against real history meant writing code, wrangling spreadsheets or paying for a terminal.

So most people skip the test and find out with real money.

1 of 3

Design

The hard part wasn't the maths. It was making a quant tool feel as simple as typing a sentence, without hiding the risk.

The input is the product

There's no feature grid above the fold. The hero, pictured at the top of this page, is a single input already filled with a real strategy: “Buy when RSI drops below 30 and price is above the 200-day average.”

A visitor understands the product before reading a word about it. Right under the input, a link lets them read a real report without creating an account.
Show the loss before the return

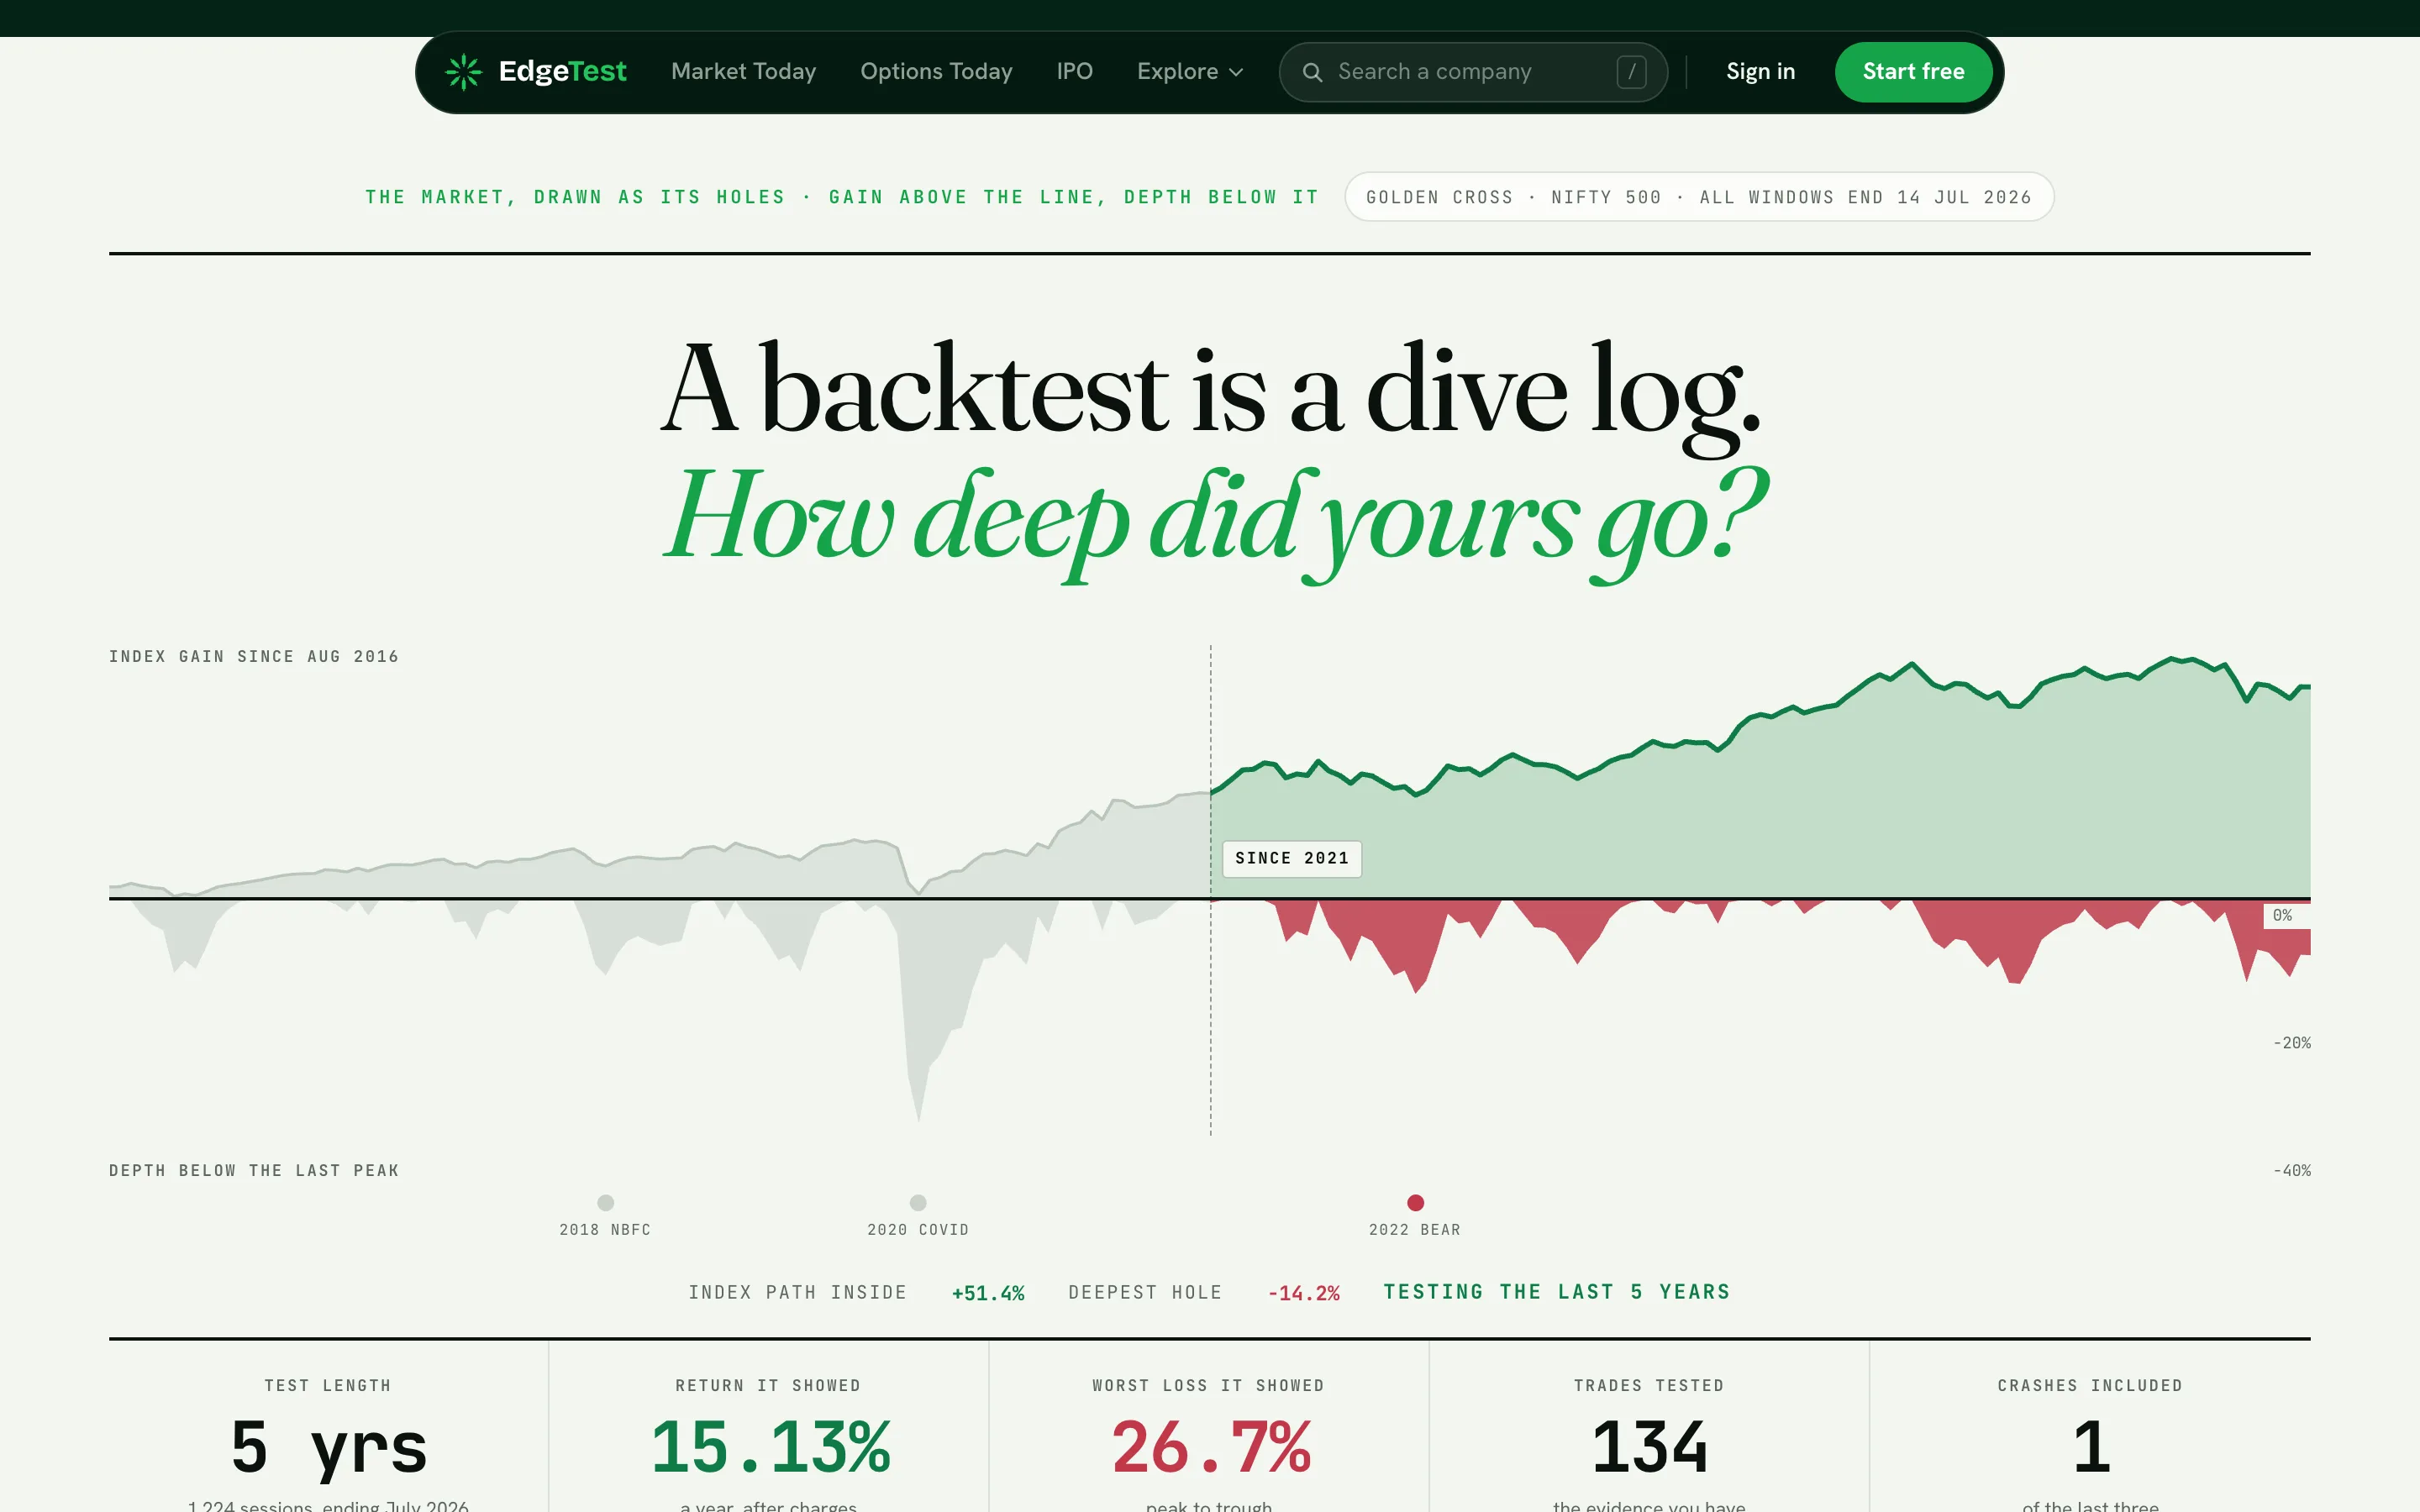
Most backtesting tools lead with the return. I framed every test as a dive log: gains above the line, depth below it, and the worst loss printed next to the return at the same size.

The copy does the same job: “Your 3-year test never left the shallows. The loss row above is the part you keep.” Every charge is itemised and every result is labelled as simulated, because in a finance product trust is the interface.

edgetest.in
Chart titled 'A backtest is a dive log' showing index gains above a line and drawdowns in red below it, with test-window buttons from 2 to 10 years
Drawdowns sit below the line in red. Switching the test window from 2 to 10 years shows how short tests hide the worst losses.

Write the numbers as sentences

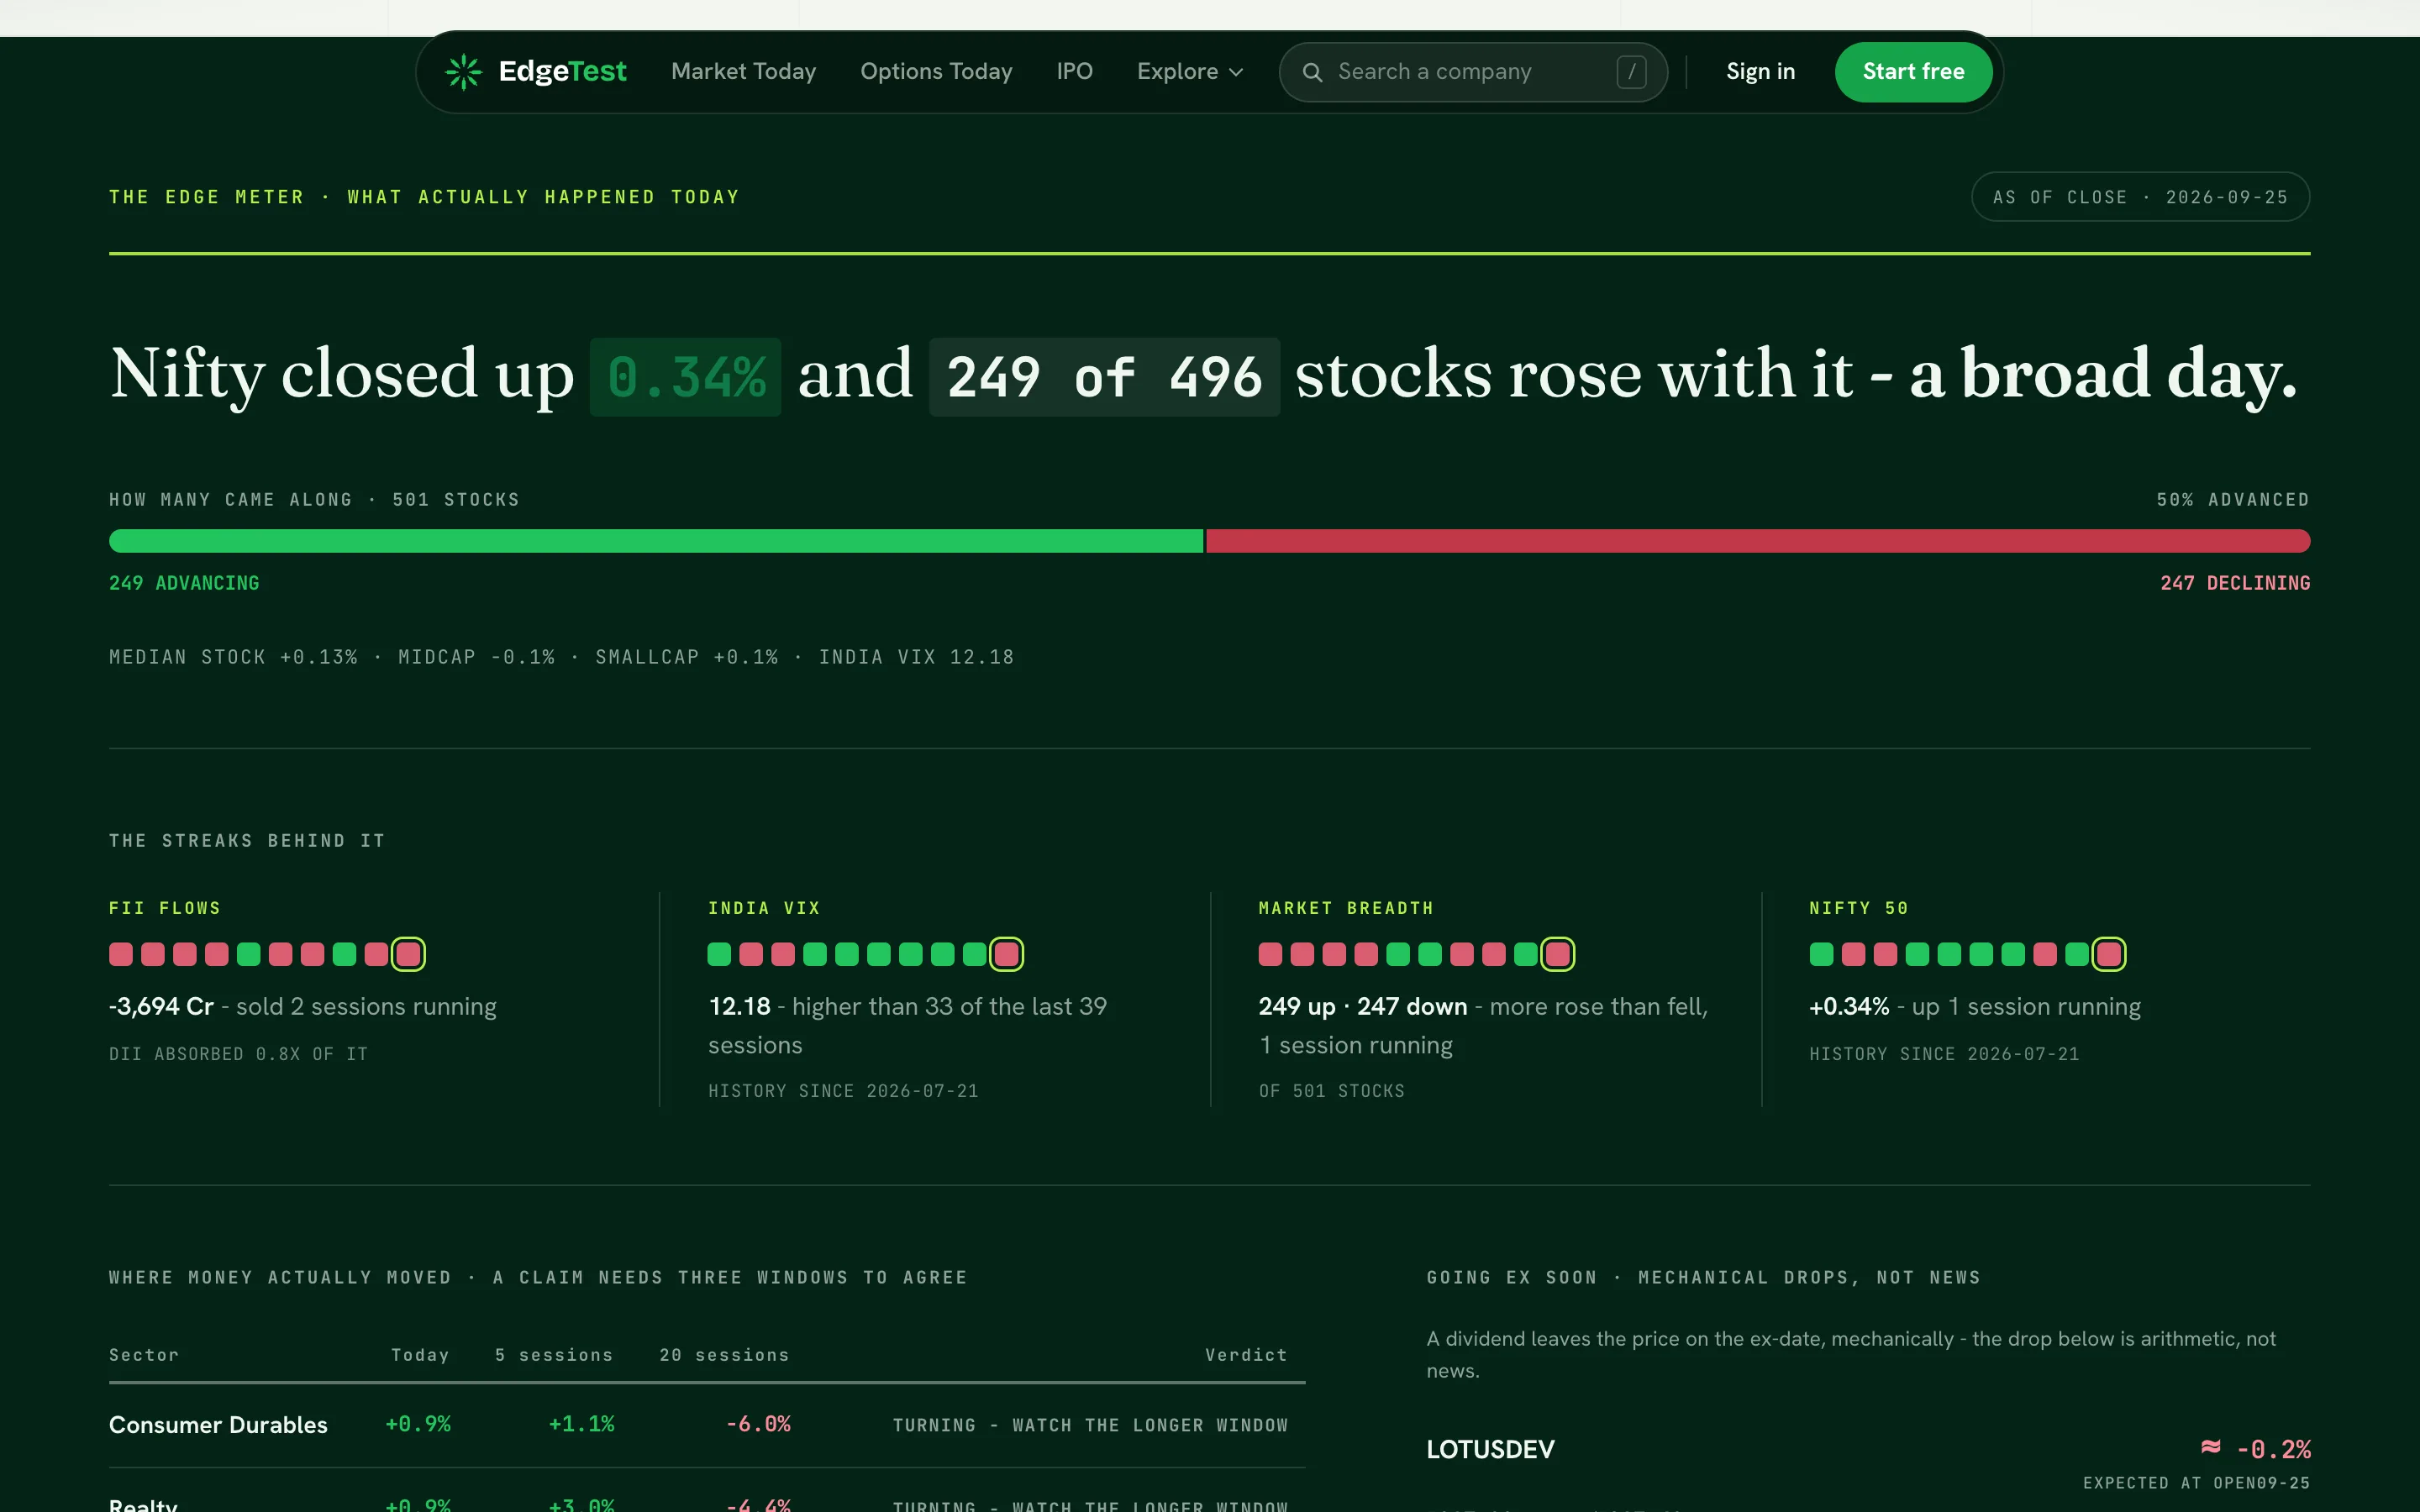
The daily market summary opens with a sentence, not a table: how the index moved, how many stocks came along, and what kind of day that makes it. The numbers inside the sentence are highlighted so they still scan.

Every reading is written by rules from that day's data, and claims only count when three time windows agree. Beginners get the plain-English line. Experienced traders get the evidence underneath it.

edgetest.in
The Edge Meter: 'Nifty closed up 0.34% and 249 of 496 stocks rose with it, a broad day', with an advance/decline bar and streak indicators
The Edge Meter leads with a generated sentence. The table comes after.

One colour, one meaning

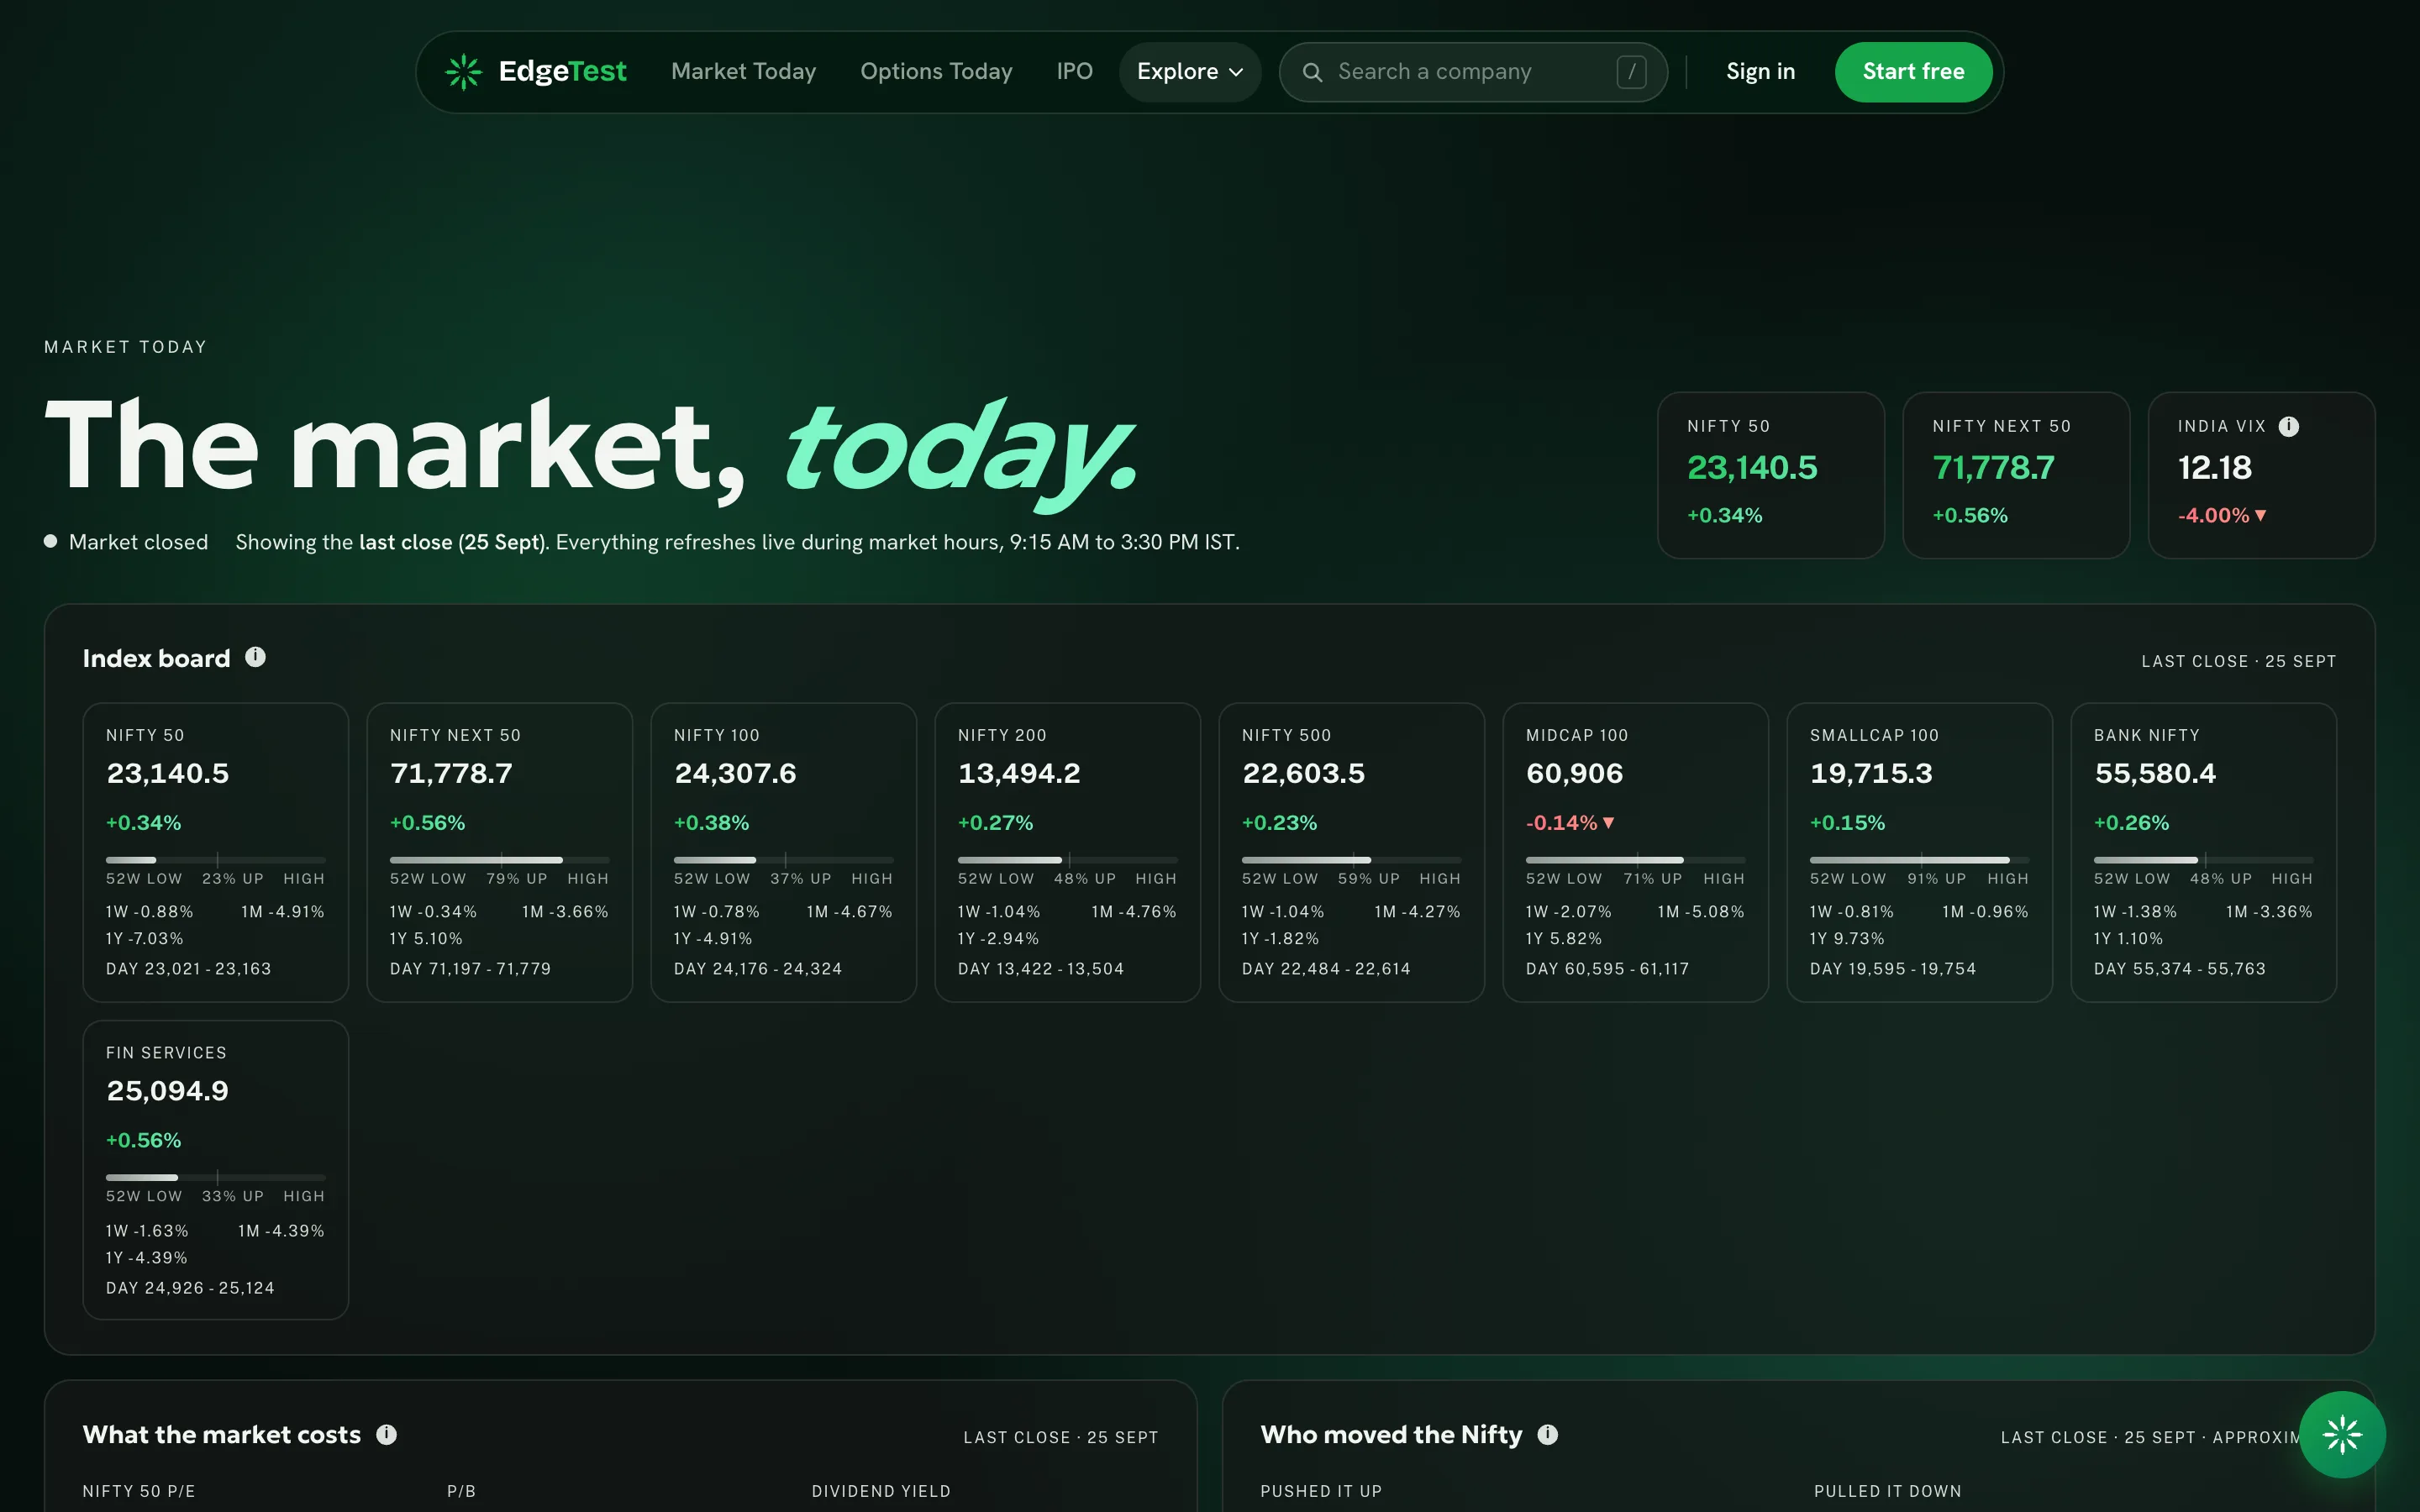
Financial dashboards tend to paint everything red and green. Here, colour is reserved for direction. The 52-week range bars are deliberately one colour, so their length is the only thing you read.

edgetest.in/market
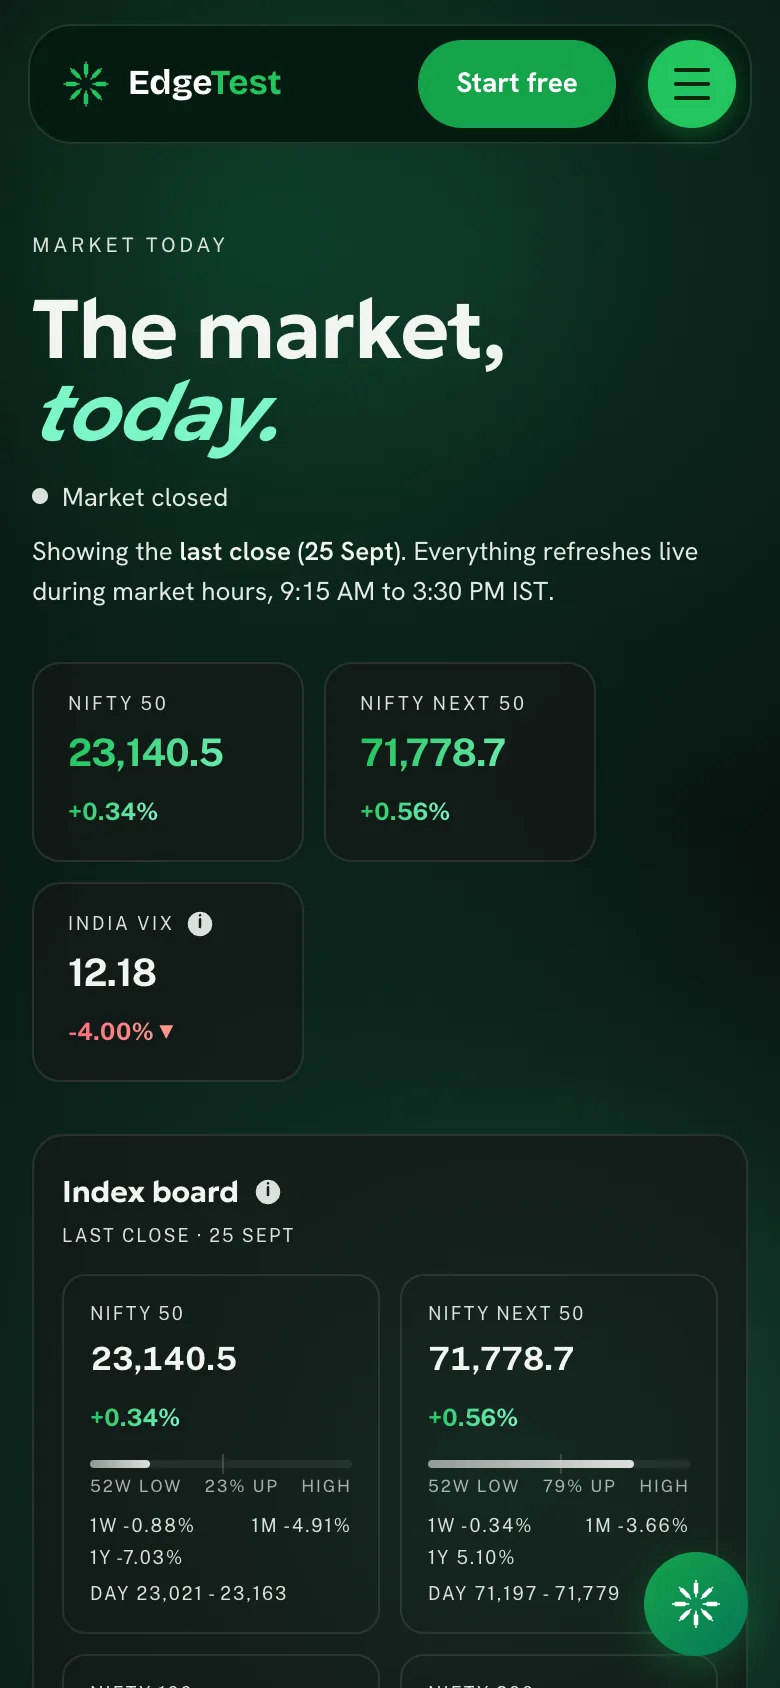
Market Today page with an index board of cards, each showing the day's move and a single-colour bar for where the index sits in its 52-week range
Green and red mean up and down, nothing else. Range bars use one neutral colour so only their length carries information.

2 of 3

Build

I built the whole stack solo: the interface, the server, the backtest engine and the data behind it.

Two surfaces, one engine

EdgeTest has a public side, with market pages, a screener and sample reports anyone can open, and a signed-in app where people write and run their own strategies. Both talk to the same backend.

A Next.js frontend handles the interface and API routes. An AI layer turns a sentence into precise trading rules, and a Python engine runs those rules across ten years of NSE prices, returning a full report in under ten seconds.

    • Public pages

      Market Today, Options Today, IPO watch, screener, sample reports

    • Signed-in app

      Strategy chat and saved results, behind Google sign-in (Supabase)

    • Next.js server

      Pages, API routes, auth checks

    • AI strategy parser

      Plain English into exact entry and exit rules

    • Python backtest engine

      Trades, charges and drawdowns across the test window

    • Market data

      3,519 listed companies: a core of about 500 with a median of ~18 years of history, the rest from 2016. Refreshed every trading day

EdgeTest system: public pages and the signed-in app both call a Next.js server, which sends strategies to an AI parser and a Python backtest engine running on ten years of NSE data.

3 of 3

Grow

A backtesting tool has no audience on day one. So the product had to bring in its own.

Free pages that do the selling

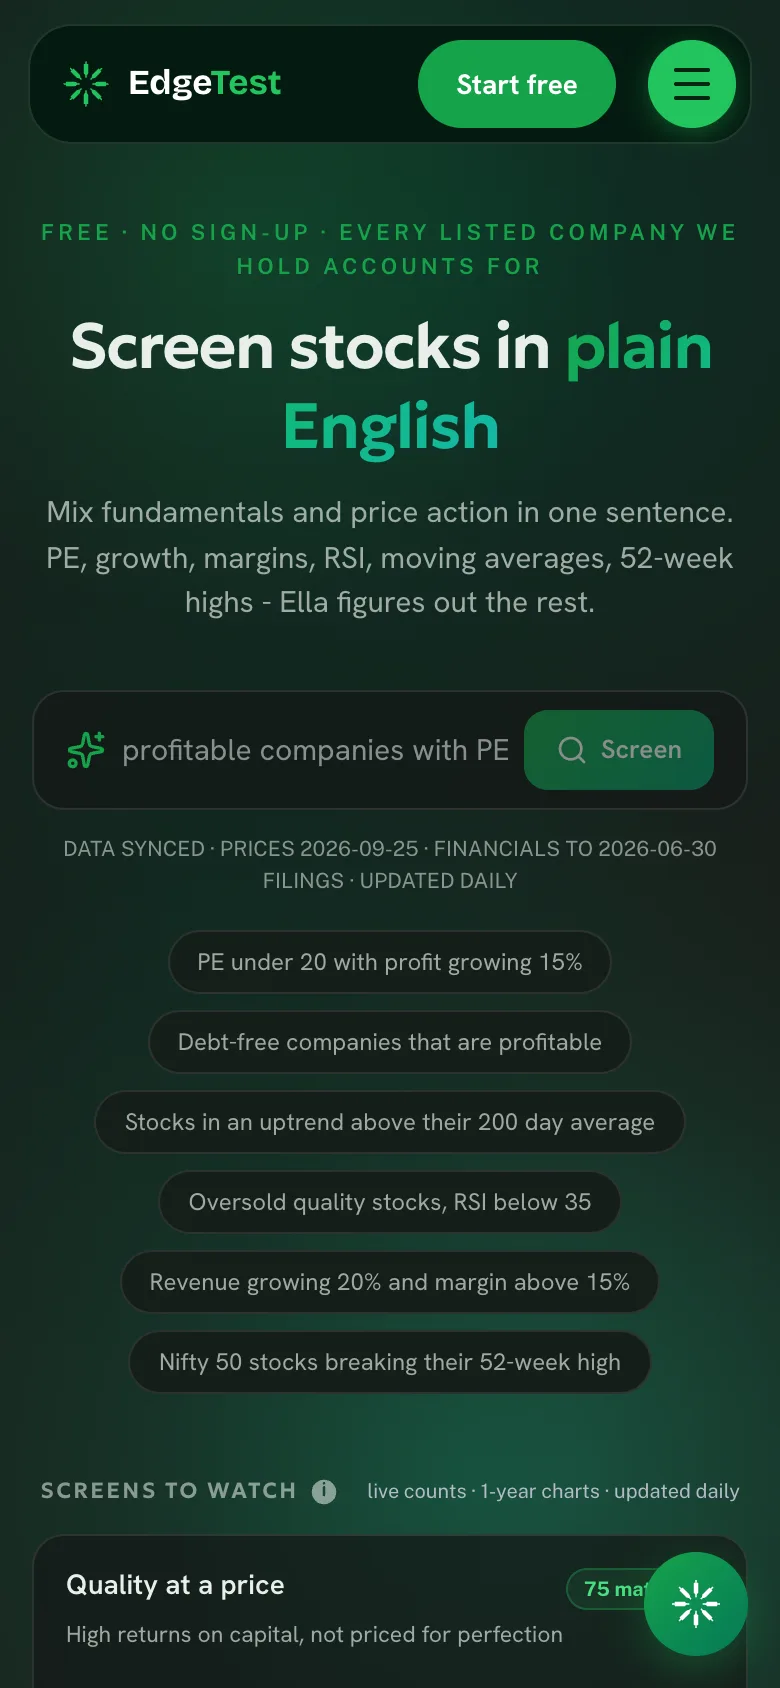
The public pages are useful on their own: a daily market read, an options summary, IPO tracking and a stock screener you can use in plain English, with no sign-up. Each one is written to answer a real search, like “free AI stock screener for Indian stocks”.

Every page ends a step closer to the product: read a sample report, then sign in with one Google button to run your own test. The daily Edge Meter has a share button, so each day's reading can travel on its own.

  1. 1

    Search

    Someone looks for a screener, an IPO date or today's market.

  2. 2

    Free tool

    They get a useful answer with no account.

  3. 3

    Sample report

    A real backtest shows what the product can do.

  4. 4

    Google sign-in

    One button. No forms, no password.

  5. 5

    First backtest

    Their own idea, tested on ten years of data.

EdgeTest home page on a phone
EdgeTest plain-English stock screener on a phone
EdgeTest Market Today page on a phone

Home, screener and Market Today on mobile.

“The hardest products make something complex feel as simple as typing a sentence. That was the entire design goal.”

Next case study

Coaching ERP

An admissions website and a role-based back office for coaching institutes.

Chat on WhatsApp